What's Shakin' in Liverpool? Title Pic

The three images below show data recorded by my home made seismograph.  The images span up to one full day's worth of data starting at midnight (GMT) and updated hourly.  

The seismometer generates two channels of output data.  The first image shows the data recorded by the low frequency channel.  The LF channel is more sensitive to long range or "teleseismic" 
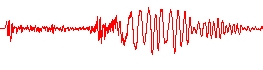
events.  The second image shows data recorded in the the high frequency channel.  The HF channel is insensitive to most distant events, but is more sensitive to nearby events.  Since I am located in central New York, there typically isn't much to see in the high frequency record.  But I can usually see most events worldwide, stronger than magnitude 6.0  or so, in the low frequency channel.  The third image shows HF channel data that has been band pass filtered to the range of 0.4 to 2.0 Hz.  For some local or regional events this filtered data will clearly show a signal that is obscure or undetectable in the unfiltered channel output.

Most of the records will show several short term transients that are caused by someone entering the room directly above the seismograph sensor, which is located in the basement.  Usually,  this happens when somebody goes in to put food in the cats' dishes, so I call these events "catastrophes" (or maybe cataclysms).

Low frequency channel output:

LF Drum Report


High frequency channel output :

HF Drum Report


Band-pass filtered HF channel:

BP Drum Report


The two images below, are generated by a seismic data analysis program (Winquake).   Winquake provides a much more detailed display of an arbitrarily chosen recent event that I have recorded on my system, along with a map that shows the event location.  When shown, the vertical lines marked P and S indicate the arrival of two distinct wave patterns that can be used to determine the distance to the event, based on the difference in arrival time.  Not all events are strong enough to show unambiguous P/S phase arrivals.  Also, due to a phenomenon of "shadowing" caused by the earth's core,  there is a range of event distances for which the P/S phases can not be seen.  Unfortunately, a very large fraction of the events that are strong enough for me to record are in this shadow zone, preventing me from making a direct measurement of the distance.

Most interesting recently recorded event

Click to hear a compressed audio file for this event.


The map below shows where the event occurred.

Event Location Map


The following drum records, from the LF and HF channels, and a band-pass filtered version of the HF channel of the seismograph, are updated from time to time to show data from "interesting" days.

Low Frequency Channel:

LF Drum X


High Frequency Channel:

HF Drum X


Band-pass filtered HF channel:

BP Filtered HF Data


Why is this "interesting"?